A 1.3-billion-person market promises the critical mass African industrialisation lacks for decades. Yet tariff cuts alone cannot dismantle structural energy deficits, fractured logistics corridors, or complex local value addition rules.
By Kirimi Mbogo
The world’s largest single free trade area by participating state count exists to solve a structural economic flaw: Africa accounts for nearly 18% of global population but generates less than 3% of global manufacturing output. By offering preferential tariff access across 54 nations, the African Continental Free Trade Area (AfCFTA) promises regional manufacturers the scale required to compete.
Yet as commercial operations under the AfCFTA Guided Trade Initiative (GTI) expand and key protocols on local value addition take effect, a hard commercial reality sets in: market size alone does not build competitive factories. Lowering border tariffs between two economies hampered by expensive power grids and congested transit corridors merely reduces the friction of moving domestic structural inefficiencies across borders.
Reflecting on this transition from simple trade integration to actual industrial transformation, H.E. Wamkele Mene, the Secretary-General of the AfCFTA Secretariat, emphasizes the shift required across the continent, stating, “We have to take active steps to make sure that we place Africa on the path of industrial development so that we are able to double intra-Africa trade with value-added goods. We have to stop being exporters of primary products to countries of the North. We have to really push domestic investment. Our African multinational corporations that are investing in Africa must feel supported. They are really our ambassadors for the rest of the world when it comes to investing here.”
Decades in the trap: Why regional trade blocs fail to deliver scale
For six decades, African industrial output remains trapped in fragmentation. Protected behind high national import duties, domestic factories operate at low volumes for small, low-income home markets. Sub-Saharan Africa’s manufacturing value added (MVA) as a share of GDP hovers around 10%, compared to over 25% across East Asia.
Previous consolidation efforts through Regional Economic Communities (RECs), such as the East African Community (EAC) or the Economic Community of West African States (ECOWAS), yield mixed structural gains. Intra-regional commerce remains constrained by overlapping trade agreements, non-tariff barriers, and missing transport links.
The AfCFTA seeks to alter this trajectory by phasing out tariffs on 90% of non-sensitive tariff lines over a five-to-ten-year period. In its Economic Report on Africa, the United Nations Economic Commission for Africa (UNECA) underscores the strategic imperative of this shift, noting that “the AfCFTA provides a framework to boost trade-led growth, unlock regional value chains, boost competitiveness and ensure that Africa transitions from being a supplier of raw materials to a producer of high-value goods and services”.
Reiterating the urgent political and economic consensus behind local processing, Kenyan President William Ruto highlights the necessity of ending raw material extraction without local value creation, stating, “Africa exports commodities while Asia exports manufactured products. That model must end. No continent industrialised that way, and Africa cannot industrialise that way either. The age of simply digging, loading and exporting must give way to an age of processing, manufacturing and exporting finished products”.
The factory-floor calculus: Power, freight, and capital costs
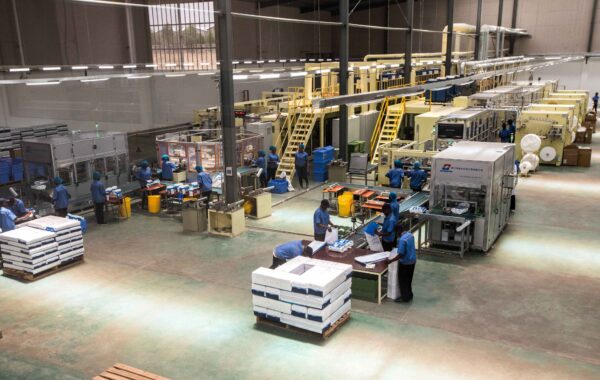
The commercial logic of the continental trade zone relies on scale economies. High-value manufacturing sub-sectors, including automotive assembly, pharmaceuticals, textile converting, and industrial agro-processing, require upfront capital expenditure that operators can only amortise across high production volumes.
Under a fragmented market structure, a factory operating in Nairobi or Accra runs below optimal capacity, driving up fixed costs per unit produced. Aggregating demand across borders allows industrial operators to boost capacity utilisation.
However, market aggregation also uncovers severe structural cost disadvantages that preferential trade tariffs cannot offset.
Commercial electricity costs across East and West Africa average between US$0.15 and US$0.28 per kilowatt-hour (kWh), compared to US$0.06 to US$0.09 per kWh in Vietnam and India. Inland logistics rates present an immense burden; transporting a 40-foot container inland along the Northern Corridor from Mombasa to Kampala or along the West Africa coastal corridor from Lagos to Tema costs between KSh 325,000 and KSh 520,000 (US$2,500 to US$4,000), frequently exceeding the ocean freight charge of shipping that same container from Shanghai to Africa’s coastline. High capital costs also limit domestic reinvestment, with nominal commercial borrowing rates across major African banking sectors ranging from 18% to 25%.
The table below provides a side-by-side comparison of these key cost metrics facing manufacturers in major African industrial hubs relative to competing global trade centers:
| Manufacturing Hub | Commercial Electricity Cost (US$/kWh) | Inland Freight Cost (US$ / container / 1,000 km) | Commercial Borrowing Rate (%) | Manufacturing Output (% of GDP) |
| Kenya (Nairobi / Ruiru Hub) | US$0.18 – US$0.22 | US$2,500 – US$3,200 | 16.0% – 19.5% | ~7.8% |
| Nigeria (Lagos / Ota Hub) | US$0.20 – US$0.28 | US$3,000 – US$4,000 | 24.0% – 28.0% | ~8.5% |
| Egypt (6th of October City Hub) | US$0.08 – US$0.11 | US$1,200 – US$1,800 | 18.0% – 22.0% | ~15.0% |
| Vietnam (Binh Duong Hub) | US$0.07 – US$0.09 | US$800 – US$1,100 | 6.0% – 8.5% | ~25.0% |
(Source Data: UNCTAD Economic Development in Africa Report, World Bank Enterprise Surveys, Central Bank Bulletins)
Following the capital: Instruments, origin rules, and market winners
Tracing the capital supporting continental manufacturing reveals who carries financial risk, how trade settlement evolves, and where commercial value accumulates.
Cross-border commerce in Africa historically relies on intermediary correspondent banks in Europe or North America, requiring double currency conversions (such as KSh to US$ to West African CFA franc). UNCTAD estimates this currency conversion friction costs African businesses over US$5 billion annually in transaction fees. To solve this, Afreximbank and the AfCFTA Secretariat operate the Pan-African Payment and Settlement System (PAPSS), allowing commercial entities to transact across borders in local currencies.
Framing PAPSS as both an economic and operational necessity, H.E. Wamkele Mene, the Secretary-General of the AfCFTA Secretariat, explains that “if you look at the cost of a transaction across regions of the continent, if your goods cost you $500, we charge you $2 to transact on PAPSS. If you use SWIFT, you will pay $60 or $70. And it is instantaneous. So it is not just about the issue of easing payments, it is also about political sovereignty”.
Highlighting the financial mechanics behind local payment rails, Afreximbank President Benedict Oramah notes, “Our goal is to reduce, significantly, the foreign currency content of intra-African trade payments, domesticate intra-regional payments and save the continent more than $5 billion in payment transaction costs per annum”.
The main strategic policy debate within the AfCFTA centres on Rules of Origin, which are the threshold regulations defining whether a product qualifies as genuinely “Made in Africa”. If origin thresholds remain too low, the free trade area risks serving as a transit point for cheap, finished goods imported from foreign markets and repackaged locally. Conversely, if value-addition thresholds sit too high, local manufacturers dependent on imported raw materials or intermediate inputs fail compliance tests and face standard non-preferential tariffs. In the automotive sector, negotiated rules demand localized component assembly and a progressive move toward 40% to 45% Regional Value Content (RVC). In textiles and apparel, agreed rules require double transformation (yarn-to-fabric-to-garment) within member states to prevent imported foreign fabrics from claiming preferential entry.
Addressing this policy balance directly, Secretary-General Wamkele Mene stresses that “the concern is that products must be manufactured in Africa and must meet our rules of origin. We have to develop an industrialization strategy and implement it along with trade policy, backed by the development finance required to invest.”
The table below outlines how commercial risks and incentives under the AfCFTA distribute across key stakeholder categories:
| Stakeholder Category | Primary Commercial Incentive | Key Operational Risk | Continental Market Positioning |
| Diversified Industrial Conglomerates (e.g., Dangote Group, Bidco Africa, Elsewedy) | Scale production across multi-country hubs and optimize regional supply chains. | Secondary-market currency devaluations and border clearance delays. | Primary Beneficiaries: Well-capitalised to build regional distribution networks. |
| Small and Medium Enterprises (SMEs) | Access cross-border buyers without establishing local subsidiaries. | Complex origin rules certification and displacement by large corporations. | Vulnerable: Highly reliant on dedicated trade finance and technical support. |
| Net Import-Dependent Governments | Attract industrial manufacturing foreign direct investment (FDI). | Immediate customs revenue losses during initial tariff phase-outs. | Transition Risk: Heavily dependent on the AfCFTA Adjustment Fund. |
Global realignment: Nearshoring and green industrial hubs
The commercial prospects for African industrial hubs increasingly take shape around broader global supply chain shifts, including corporate nearshoring, supply chain diversification, and carbon reduction mandates.
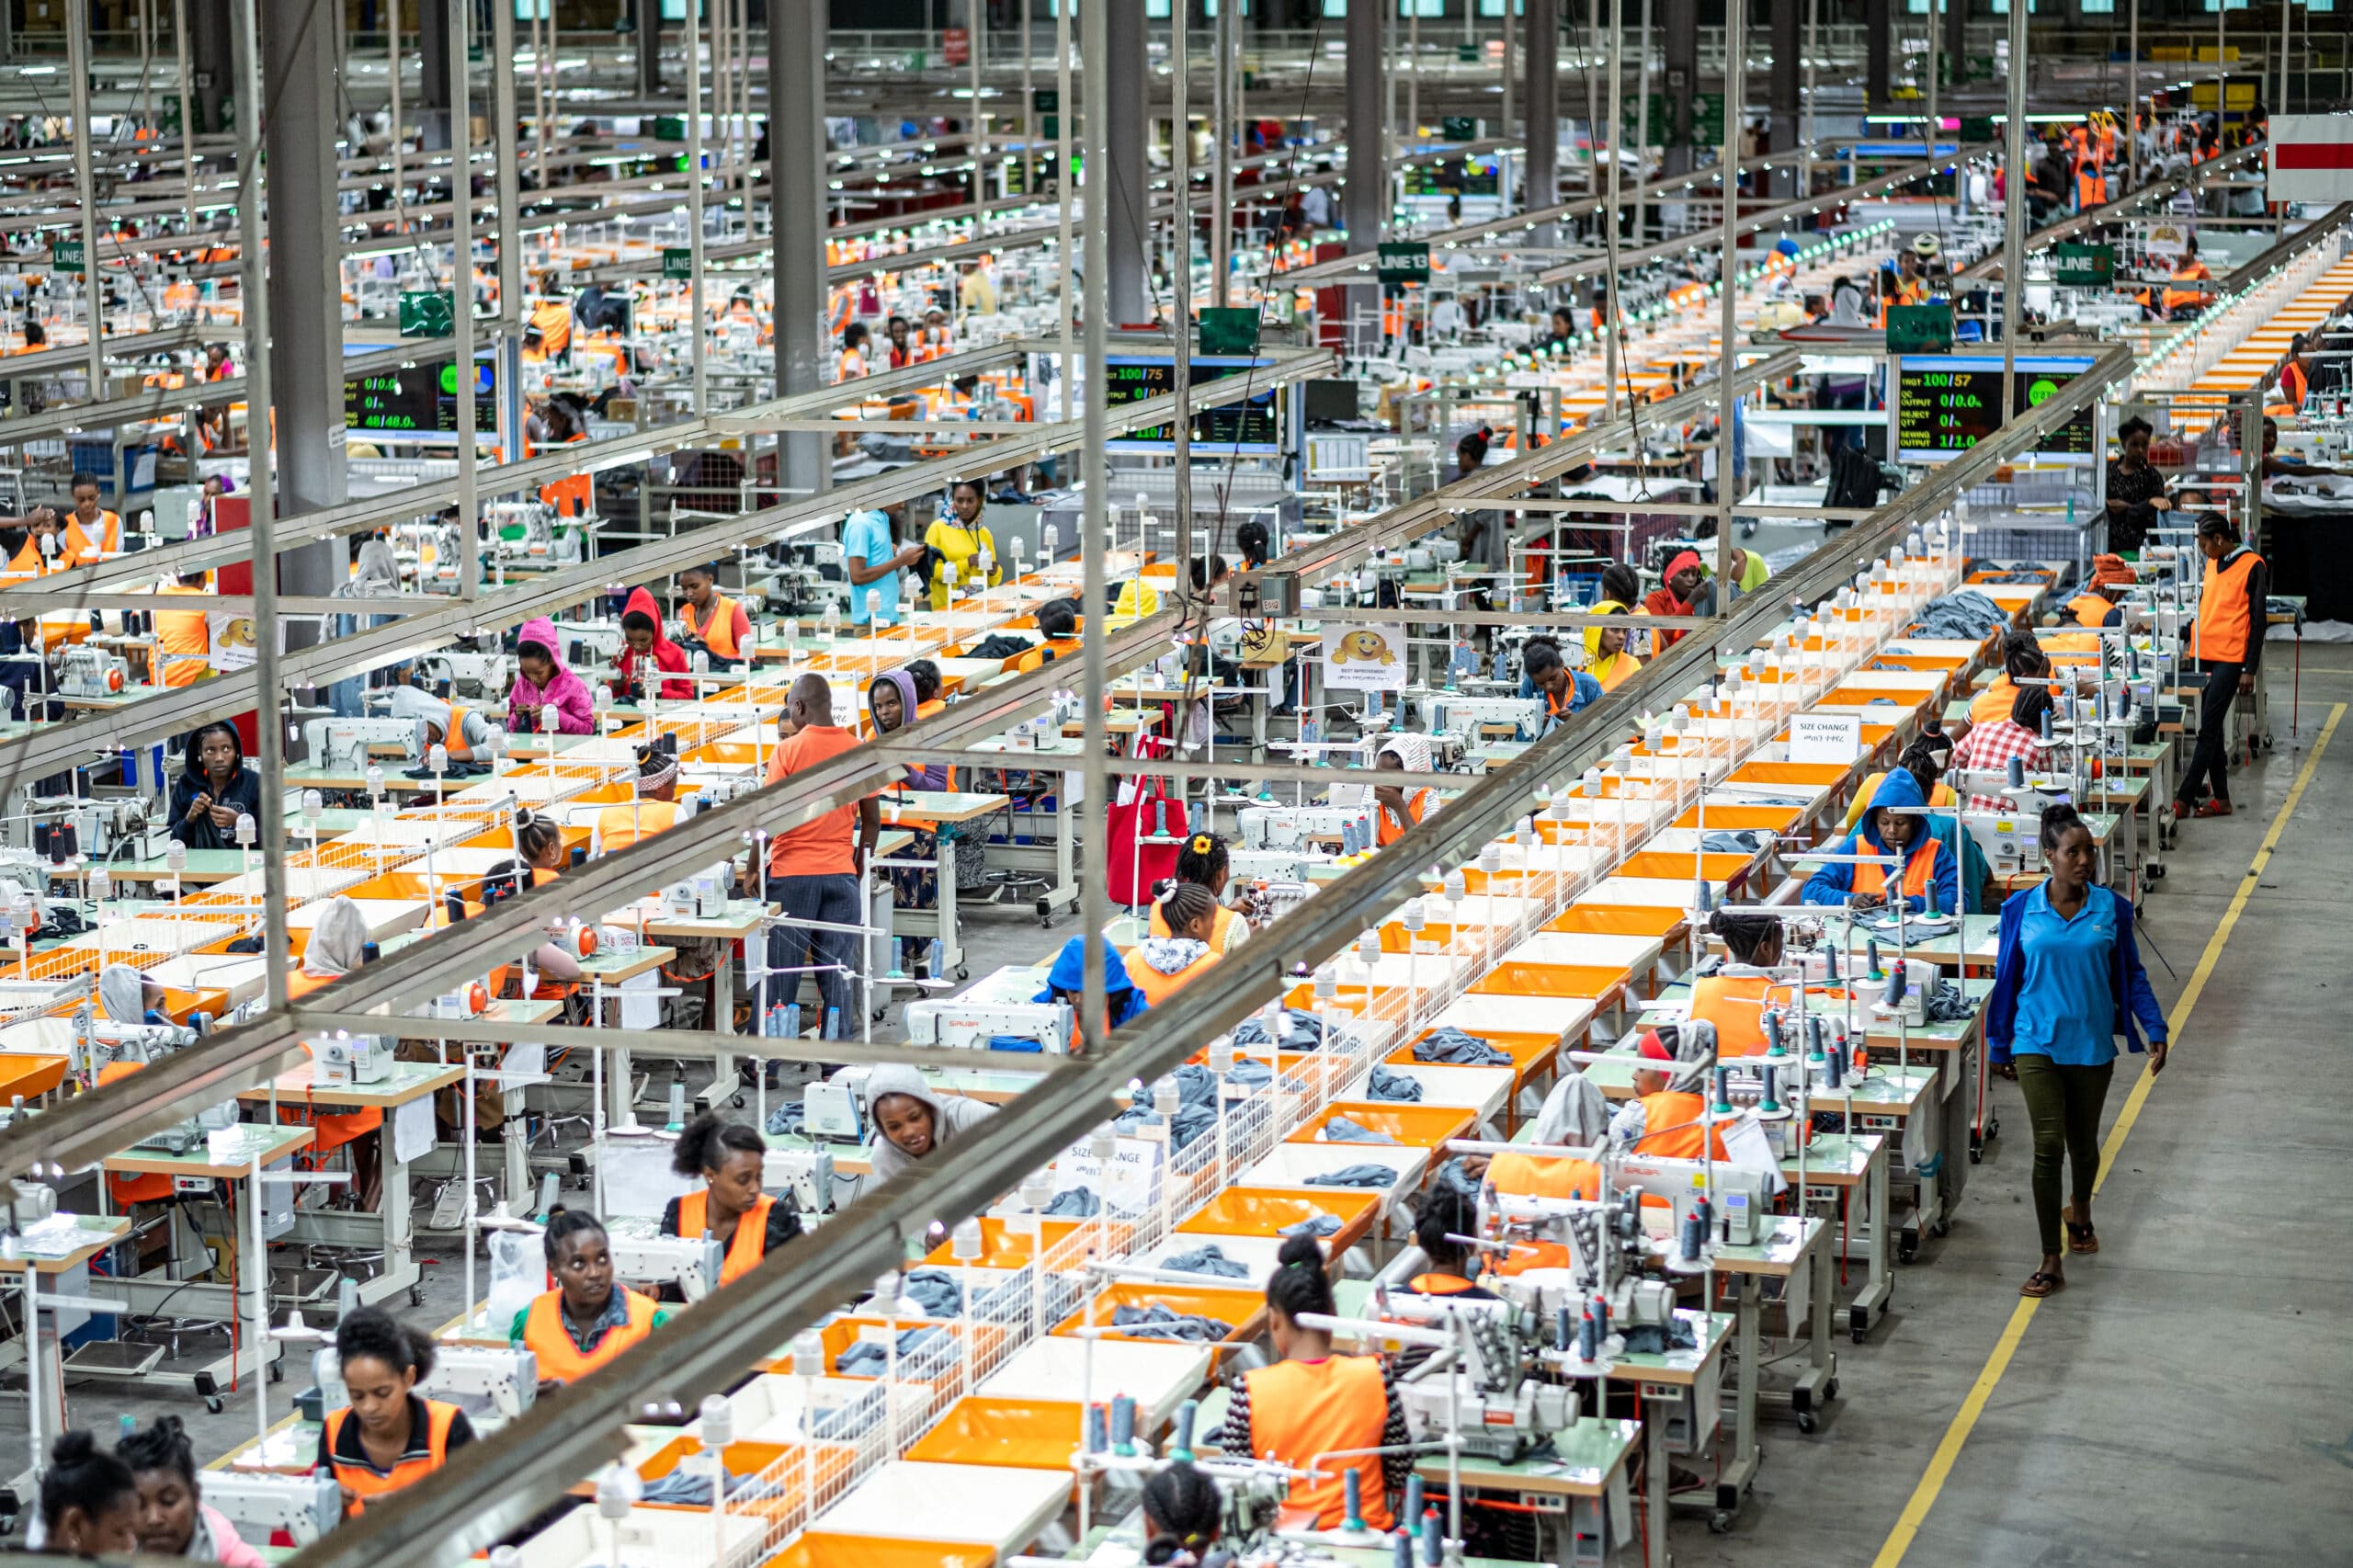
Regional manufacturing bases adopt distinct strategic approaches across the continent. In North Africa, Morocco and Egypt integrate into European automotive and industrial value chains by pairing deep-sea port terminals (such as Tanger-Med) with tax-exempt industrial zones. In East Africa, Kenya and Ethiopia position themselves around apparel and light green manufacturing, using renewable geothermal and hydroelectric power grids to attract sustainability-focused global buyers. Meanwhile, in Southern Africa, South Africa retains the continent’s most developed automotive industrial ecosystem, but faces persistent domestic power constraints and freight rail bottlenecks that erode its export competitiveness.
Examining these capital flows, UNCTAD highlights in its Economic Development in Africa Report that “African investors finance a growing share of international greenfield projects in services and manufacturing on the continent, demonstrating that domestic capital is increasingly taking the lead in industrial value addition”.
Catalysts to watch: Structural metrics for business leaders
For executive decision-makers, tracking whether the AfCFTA translates into true industrial competitiveness requires monitoring several critical structural shifts.
The speed at which non-tariff barriers resolve remains paramount. While duty rates fall on paper, administrative border checks, varying product standards, and irregular customs delays remain the largest operative tax on regional trade.
The pace of PAPSS integration among commercial banks indicates true progress. Widespread adoption of PAPSS by central banks and Tier-1 commercial lenders signals whether transaction friction costs genuinely come down for mid-sized manufacturers.
National industrial policy coordination determines long-term efficiency. Without cross-border policy coordination, individual states risk creating redundant industrial investments, such as competing, underutilised auto assembly plants, rather than complementary regional value chains.
Transport infrastructure capital allocation dictates market access. UN ECA estimates that full AfCFTA implementation requires over US$120 billion in transport equipment investments alone to link regional production hubs to consumer markets.
The Ledger angle
Trade agreements do not build competitive factories; they merely allocate market access. Economic fundamentals, namely input costs, freight efficiency, and capital availability, determine who captures that market.
The ultimate test of the AfCFTA does not sit in signed protocols or initial tariff reduction schedules. It rests on whether African regional manufacturers can drive unit production costs down to levels competitive with foreign imports. Until domestic energy, freight, and capital costs fall, an integrated continent risks serving as a more efficient distribution network for non-African products, rather than the launchpad for African industry.