
Kenya’s headline inflation rate conceals sharp differences in the cost of essentials. Food and transport prices are rising at different rates, while wage statistics offer only a partial picture of whether households can keep up.
By The Ledger Africa Editorial Desk
Kenya’s household budget is under pressure from a combination of rising food and transport costs, even as the national inflation rate remains far below the double-digit levels recorded during the 2022–23 cost-of-living shock. The latest figures suggest that the price of getting to work and putting food on the table deserves closer attention than the headline inflation number alone.
In September 2026, annual consumer price inflation stood at 6.8%, according to the Kenya National Bureau of Statistics (KNBS). But the average conceals substantial differences between categories. Food and non-alcoholic beverages became 9.5% more expensive over the year, transport prices rose by 15.6%, while housing, water, electricity, gas and other fuels increased by 3.2%.
For households that spend a large share of their income on food and commuting, those increases can matter more than the national average. For others, rent, school fees, medical bills or debt repayments may dominate the monthly budget.
The question is not simply whether prices are rising. It is whether earnings can buy the same essentials as before.
Inflation is not the same as affordability
Inflation measures the rate at which prices change. It does not measure the proportion of a household’s income consumed by those prices, nor does it establish whether that household can afford its basic needs.
When inflation falls, prices generally rise more slowly. They do not necessarily return to earlier levels. A family that has already adjusted its shopping list, changed its commuting arrangements or postponed a purchase may continue to feel the effects even when the inflation rate moderates.
Kenya’s consumer price index, compiled by KNBS, tracks a weighted basket of goods and services. The weights reflect expenditure patterns across the population covered by the index. Individual households, however, have different spending patterns, locations and income sources.
A salaried household that owns its home experiences the economy differently from a casual worker renting in Nairobi. A rural household that produces some of its own food faces different costs from an urban household that buys nearly everything it consumes. Neither experience is adequately represented by a single inflation figure.
This is why the composition of inflation matters as much as its headline rate.
Food and transport are doing the damage
The September figures point to two categories putting particular pressure on household budgets.
Food and non-alcoholic beverages inflation of 9.5% means the category’s price index was nearly a tenth higher than a year earlier. Transport inflation of 15.6% indicates an even sharper annual increase. The housing, water, electricity, gas and other fuels category rose more slowly, at 3.2%.
These are category-level changes, not bills faced by every household. Transport inflation, for example, does not mean every commuter’s fares rose by exactly 15.6%. The change in an individual’s costs depends on the routes travelled, the services used and how often they travel.
Yet transport costs can spread through the wider economy. Higher costs of moving workers, food and goods can affect prices paid by consumers and operating expenses faced by businesses. The extent of that effect varies by sector and cannot be inferred from the inflation figure alone.
Food inflation has a similarly uneven impact. A household that spends a large share of its budget on staples has less room to absorb price increases than one with more disposable income. If food costs rise faster than earnings, families may have to reduce spending elsewhere, even when their nominal income has not fallen.
The national figures establish that these categories have become more expensive. They do not, on their own, establish how much a typical household has cut from its budget or which families have suffered the largest loss in purchasing power.
What do wage figures tell us?
The latest annual earnings data provide some context, although they do not offer a complete measure of household income.
KNBS’s Economic Survey 2026 estimates that real average earnings per employee reached KSh678,800 in 2025, up from KSh665,400 in 2024. That represents an increase of about 2% after adjustment for inflation.
Real earnings measure the purchasing power of pay after accounting for changes in prices. On this measure, average earnings improved modestly in 2025.
But the figure needs careful interpretation. It is an average for employees covered by the earnings statistics, not the median income of Kenyan households. It does not capture every informal worker, unemployed person, self-employed trader or household dependent on irregular earnings and transfers.
Nor does a national average reveal how gains were distributed. Some workers may have received substantial pay increases, others none, and some may have lost work or experienced falling income.
The earnings data also cover 2025, while the latest inflation figures cited above compare September 2026 with September 2025. They are different periods and should not be presented as a direct, like-for-like comparison.
The evidence therefore supports a cautious conclusion: average real employee earnings increased in 2025, but that improvement does not establish that households have kept pace with the subsequent cost increases in food and transport.
The minimum wage offers another perspective
Statutory minimum wages provide a different test of affordability, particularly for workers in lower-paid occupations. But a legal wage floor is not the same as the amount a worker actually receives, and it does not describe earnings across the informal economy.
Kenya’s 2026 general wage order revised minimum pay rates with effect from 1 May 2026. The applicable rate varies by occupation and location, and the basic monthly figures generally exclude housing allowance.
To assess what these changes mean for living standards, the wage increases must be compared with the cost of a defined basket of essentials over the same period. It would be misleading to compare one minimum-wage rate with the national inflation figure and declare that workers are better or worse off without considering the timing, applicable wage category and actual expenditure pattern.
The same discipline applies to household budgets. Rent, school fees, electricity and transport do not necessarily change at the same rate, and the impact depends on how much of a family’s income each expense consumes.
The missing measure is household purchasing power
Kenya has a detailed historical source for understanding household expenditure. The KNBS Integrated Household Budget Survey of 2015/16 collected information on household income, credit, food consumption, rent, education, healthcare and other expenses.
That survey remains useful for understanding how household budgets are structured. But its expenditure patterns are too old to be treated as a current picture without qualification.
A stronger assessment would combine updated price indices with recent household expenditure data and earnings information, separating households by income, location and employment type. It would also distinguish the cost of goods bought regularly from less frequent expenses such as school fees, medical treatment and major household purchases.
That matters for public policy. An inflation rate that looks manageable at national level may still place considerable pressure on households whose incomes are low or irregular. Equally, a rise in a particular price index does not prove that every family has become poorer. The distribution of income, expenditure and price changes must be examined.
For businesses, the same distinction matters. Rising household costs can alter demand, influence the products consumers buy and increase pressure on employers to raise pay. But the scale of these effects needs to be measured rather than assumed.
What the numbers should settle next
The latest data show that food and transport prices have risen faster than the overall consumer price index. They also show that average real employee earnings improved in 2025, although that earlier increase cannot establish whether households kept pace with costs in 2026.
What remains unresolved is the central question of affordability: how much income does a household need to maintain its previous standard of living, and how has that requirement changed relative to what it earns?
Answering it requires comparable price and income series, updated household spending patterns and a clear distinction between formal employees and the wider population.
Until those measures are brought together, the inflation rate can tell Kenyans how quickly prices are changing. It cannot, by itself, tell them how far their household budgets will stretch.
Data-graphic brief
The cost of essentials is rising unevenly
Annual change in Kenya’s consumer price indices, September 2025 to September 2026
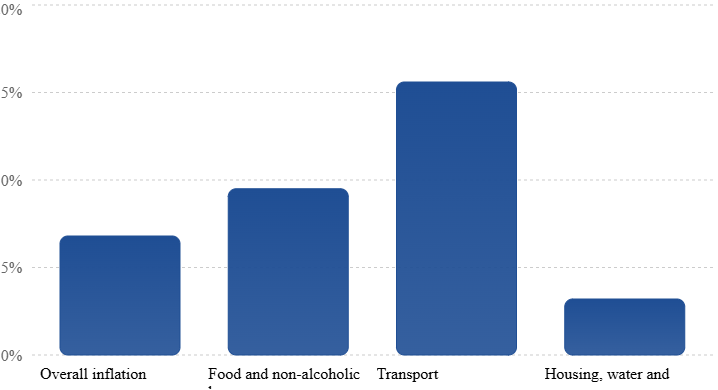
Source: KNBS, Consumer Price Indices and Inflation Rates, September 2026. Annual percentage changes; national CPI categories, not individual household bills.